
Monitoring Remote Sites with Traefik and Prometheus
Published on:Table of Contents
I have several sites deployed on VPSs like DigitalOcean that have been dockerized and are reverse proxied by traefik so they don’t have to worry about Let’s Encrypt, https redirection, etc. Until recently I had very little insight into these sites and infrastructure. I couldn’t answer basic questions like:
- How many requests is each site handling
- What are the response times for each site
- Is the box over / underprovisioned
For someone who has repeatedly blogged about metrics and observability (here, here, here, here, and here) – this gap was definitely a sore spot for me. I sowed the gap shut with traefix static routes, prometheus metrics, basic authentication, and Let’s Encrypt.
Do note that this article assumes you already having a working setup with traefik and let’s encrypt.
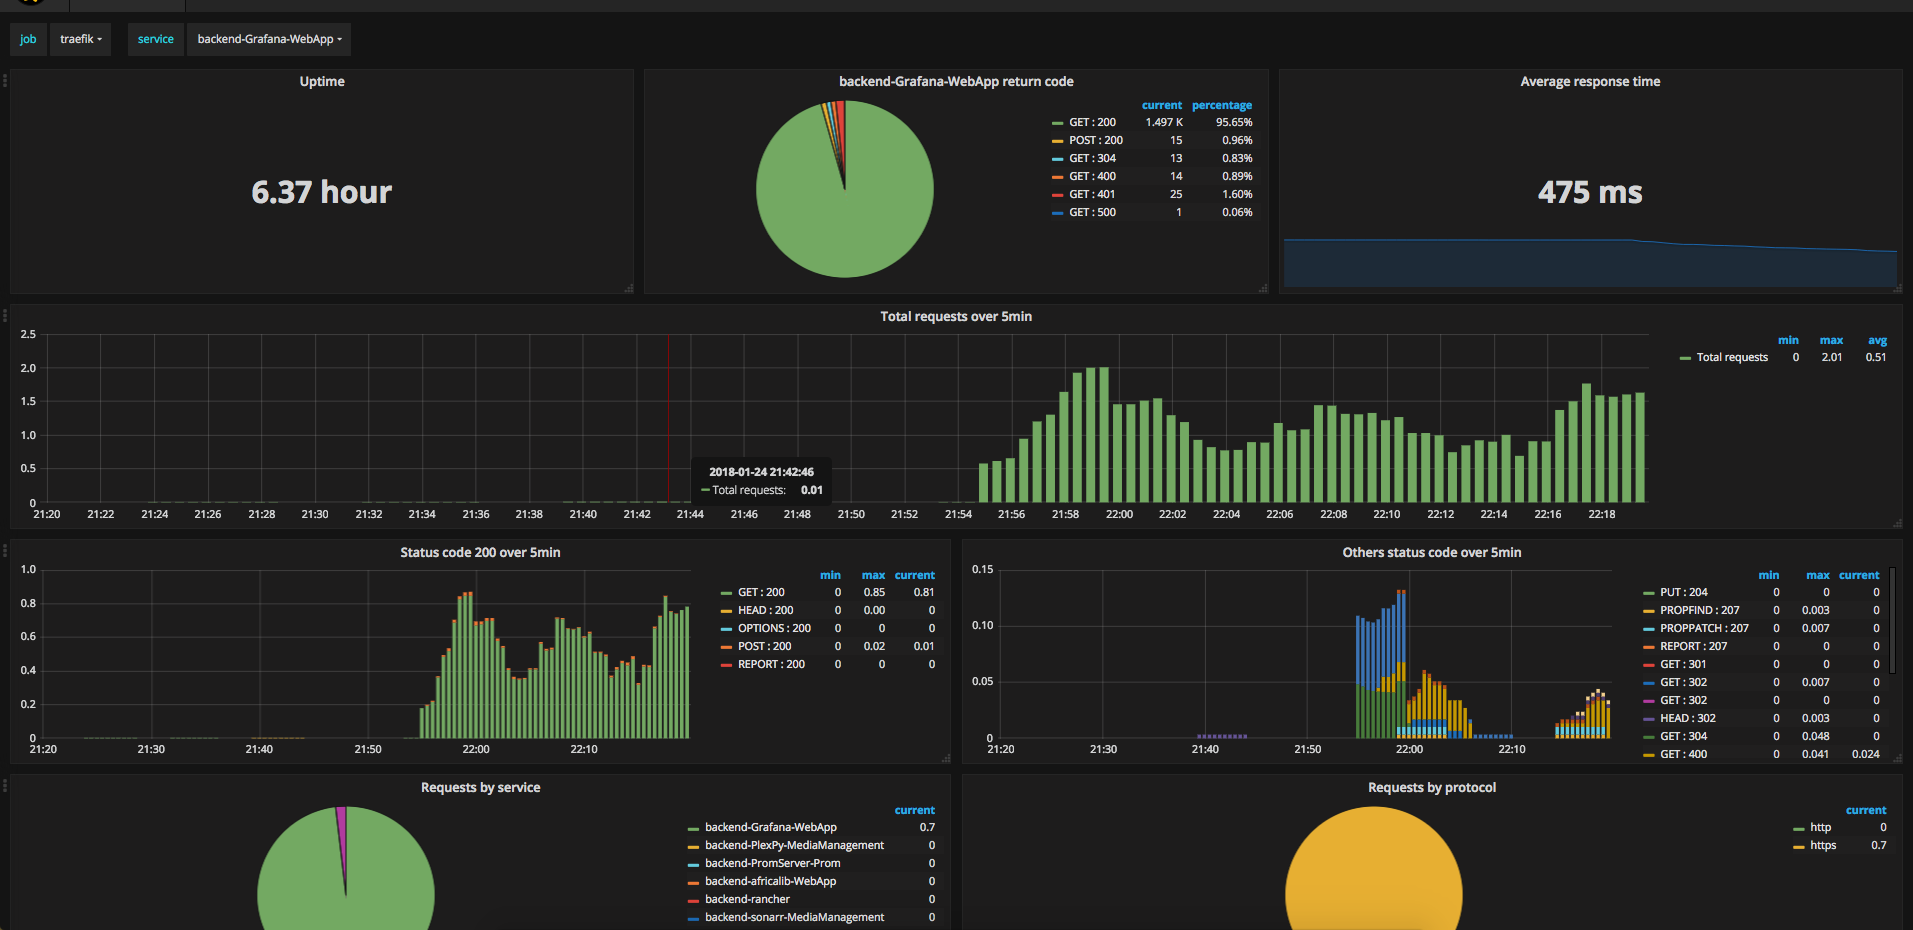
Grafana dashboard of metrics exported by Traefik
Exposing Traefik Metrics
Traefik keeps count of how many requests each backend has handled and the duration of these requests. Traefik exposes several possibilities for exporting these metrics, but only one of them is a pull model, which is prometheus. A pull model is ideal here as it allows one to be able to track metrics from a laptop without any errors on the server side, and one can more easily tell if a service has malfunctioned. So we’ll allow metrics to be exposed with a modification to our traefik.toml
[metrics]
    [metrics.prometheus]
If traefik is running inside a docker container (in my case, docker compose) the default api port needs to be exposed.
services:
  traefik:
    # ... snip
    ports:
      - 80:80
      - 443:443
      - 8080:8080
Now once traefik starts, we can retrieve metrics from http://<server-ip>:8080/metrics. Three things wrong:
- Metrics broadcast to the entire internet. We need to lock this down to only authenticated individuals.
- Metrics served over http so others can snoop on the metrics.
- Typically I find it preferable to lock traffic down to as few ports as possible.
We fix these issues by binding the listening address to localhost, and reverse proxying through a traefik frontend that forces basic authentication and TLS.
To bind port 8080 so it only listens locally, update the docker compose file
     ports:
       - 80:80
       - 443:443
-      - 8080:8080
+      - "127.0.0.1:8080:8080"
Now let’s proxy traffic through a basic auth TLS frontend.
First, create a prometheus user with a password of “mypassword” encoded with bcrypt using htpasswd (installed through apache2-utils on Ubuntu):
$ htpasswd -nbB prometheus mypassword
prometheus:$2y$05$JMP9BgFp6rtzDpAMatnrDeuj78UG7W05Zr4eyjtq2i7.gk0KZfcIC
Potential performance issues with constantly authenticating using bcrypt can be mitigated with SHA1. Though in practice CPU usage is less than 1%.
Next, we configure traefik using the file directive. This basically configures traefik with static routes – think nginx or apache. While not explicitly mentioned anywhere, one can configure traefik with as many route providers as necessary (in this case, docker and file). A nice feature is that the file provider can delegate to a separate file that can be watched so traefik doesn’t need to be restarted on config change. For the sake of this article, I’m keeping everything in one file.
Add the below to traefik.toml. It’ll listen for metrics.myapp.example.com, only allow those who authenticate as prometheus, and then forward the request to our traefik metrics.
[file]

[backends]
  [backends.internal-traefik]
    [backends.internal-traefik.servers.server1]
       url = "http://127.0.0.1:8080"

[frontends]
  [frontends.internal-traefik]
      backend = "internal-traefik"
      basicAuth = ["prometheus:$2y$05$JMP9BgFp6rtzDpAMatnrDeuj78UG7W05Zr4eyjtq2i7.gk0KZfcIC"]

      [frontends.internal-traefik.routes.metric-route]
          rule = "Host:metrics.myapp.example.com"
Note that this relies on Let’s Encrypt working, as metrics.myapp.example.com will automatically be assigned a cert. Pretty neat!
Exposing System Metrics
We now have a slew of metrics giving insights into the number of requests, response times, etc, but we’re missing system metrics to know if we’ve over or under provisioned the box. That’s where node_exporter comes into play. It’s analogous to collectd, telegraf, and diamond, but it is geared for prometheus’s pull model.
While one can use the prometheus-node-exporter apt package, I opted to install node_exporter’s latest version right from Github Releases. I avoided installing via docker as the readme states “It’s not recommended to deploy it as a Docker container because it requires access to the host system”. No major harm done, the node_exporter package is a single executable.
Executing it reveals some work to do.
$ ./node_exporter
INFO[0000] Listening on :9100
- Plain http
- Internet accessible port 9100
The official standpoint is that anything requiring auth or security should use a reverse proxy. That’s fine, good to know.
Downloading just an executable isn’t installing it, so let’s do that now before we forget. This is for systemd, so steps may vary.
cp ./node_exporter /usr/sbin/.
useradd --no-create-home --shell /usr/sbin/nologin --system node_exporter
cat > /etc/systemd/system/node_exporter.service <<EOF
[Unit]
Description=Node Exporter

[Service]
User=node_exporter
ExecStart=/usr/sbin/node_exporter

[Install]
WantedBy=multi-user.target
EOF

systemctl enable node_exporter
systemctl start node_exporter
Now we’ll add authentication and security.
Node Exporter through Traefik
Now that we have multiple metric exporters on the box, it may seem tempting to look for a solution that aggregates both exporters so we only need to configure prometheus to scrape one endpoint. One agent to rule them all goes into depth as to why that’d be a bad idea, but the gist is operational bottlenecks, lack of isolation, and bottom up configuration (instead of top down like prometheus prefers).
Ok two endpoints are needed for our two metric exporters. We could split our metrics.myapp.example.com into traefik.metrics.myapp.example.com and node.metrics.myapp.example.com (phew!). This is a fine approach, but I’m going let the Let’s Encrypt servers have a breather and only work with metrics.myapp.example.com. We’ll have /traefik route to /metrics on our traefik server and /node-exporter appropriately.
I’ll post traefik.toml config with commentary following:
[file]

[backends]
  [backends.internal-traefik]
    [backends.internal-traefik.servers.server1]
       url = "http://127.0.0.1:8080"

  [backends.internal-node]
    [backends.internal-node.servers.server1]
       url = "http://172.17.0.1:9100"

[frontends]
  [frontends.internal-traefik]
      backend = "internal-traefik"
      basicAuth = ["prometheus:$2y$05$JMP9BgFp6rtzDpAMatnrDeuj78UG7W05Zr4eyjtq2i7.gk0KZfcIC"]

      [frontends.internal-traefik.routes.metric-route]
          rule = "Host:metrics.myapp.example.com;Path:/traefik;ReplacePath:/metrics"

  [frontends.internal-node]
      backend = "internal-node"
      basicAuth = ["prometheus:$2y$05$JMP9BgFp6rtzDpAMatnrDeuj78UG7W05Zr4eyjtq2i7.gk0KZfcIC"]

      [frontends.internal-node.routes.metric-route]
          rule = "Host:metrics.myapp.example.com;Path:/node-exporter;ReplacePath:/metrics"
The backend for internal-node is “172.17.0.1” and not “127.0.0.1”. 172.17.0.1 is the ip address of the docker bridge. This interface links containers with each other and the outside world. If we had used 127.0.0.1 that would be traffic local to traefik inside it’s container (which node-exporter is not inside, it resides on the host system). The bridge ip address can be found by executing:
docker network inspect bridge --format='{{ "{{(index .IPAM.Config 0).Gateway"}}}}'
We now can update the node-exporter to listen to internal traffic only on 172.17.0.1.
node_exporter --web.listen-address="172.17.0.1:9100"
Other notes:
- One can’t override the backend in a frontend route based on path, so two frontends are created. This means that the config turned out a bit more verbose.
- This necessitates another entry for basic auth. In this example I copied and pasted, but one could generate a new bcrypt hash with the same password or use a different password
- Each frontend rule uses the
ReplacePathmodifier to change the path to/metricsso something like/node-exportergets translated to127.17.0.1:9100/metrics - I prefix each frontend and backend endpoint with “internal” so that these can be excluded in prometheus queries with a simple regex.
Now it’s time for prometheus to actually scrape these metrics.
Enter Prometheus
The prometheus config can remain pretty bland, if only a bit redundant.
scrape_configs:
  - job_name: 'traefik'
    scheme: https
    basic_auth:
      username: prometheus
      password: mypassword

    metrics_path: "/traefik"
    static_configs:
    - targets: ['metrics.myapp.example.com']

  - job_name: 'node-exporter'
    scheme: https
    basic_auth:
      username: prometheus
      password: mypassword

    metrics_path: "/node-exporter"
    static_configs:
    - targets: ['metrics.myapp.example.com']
And finally Grafana
I haven’t quite got the hang of promQL, so I’d recommend importing these two dashboards:
Play with and tweak as needed.
Conclusion
Definitely a lot of pros with this experience
- Traefik contains metrics and only needed configuration to expose
- Traefik can reverse proxy through static routes in a config file. I was worried I’d have to setup basic auth and tls through nginx, apache, or something like ghost tunnel, which I’m unfamiliar with. I love nginx, but I love managing fewer services more.
- Installing node_exporter was a 5 minute ordeal
- Pre-existing Grafana dashboards for node_exporter and traefik
- A metric pull model sits more comfortably with me, as the alternative would be to push the metrics to my home server where I house databases such as graphite and timescale. Pushing data to my home network is a lovely thought, but one I don’t want to depend on right now.
In fact, it was such a pleasant experience that even for boxes where I don’t host web sites, I’ll be installing this traefik setup for node_exporter.
Comments
If you'd like to leave a comment, please email [email protected]
been looking at a couple of your post and looks like you are using prometheus for this, are you still using graphite as well? how are you using both systems?
I have found there is no one leader in time series databases: