
Simulating the EU4 map in the browser with WebGL
Published on:Table of Contents
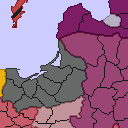
The age old question for EU4 map staring developers (or at least me) is asking how the game transforms a relatively low resolution map where each province is coded with unique color:
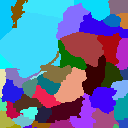
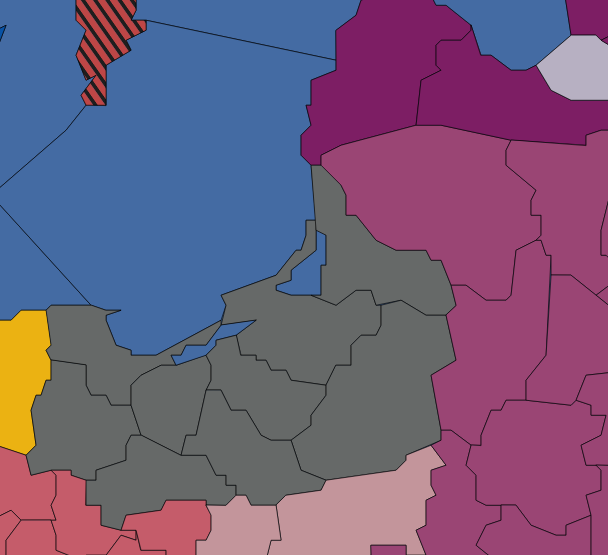
1:1 section of game map focused on the eastern baltic sea region
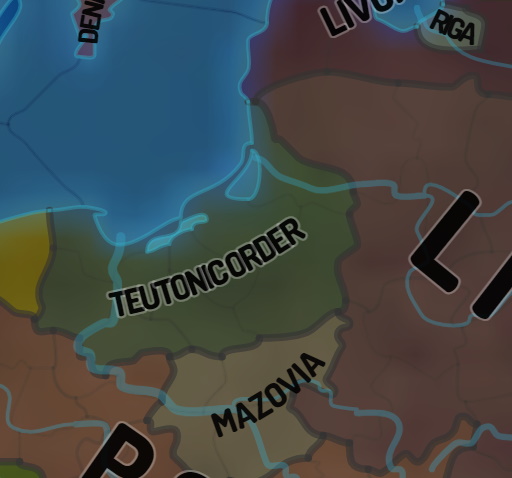
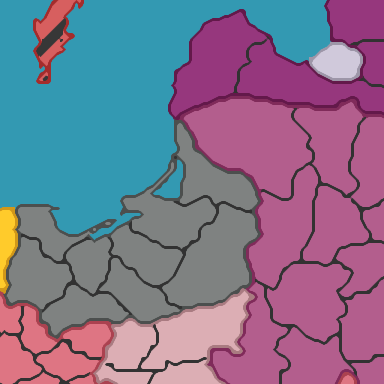
into a much richer experience once in game (the image below can be clicked to show the true size):
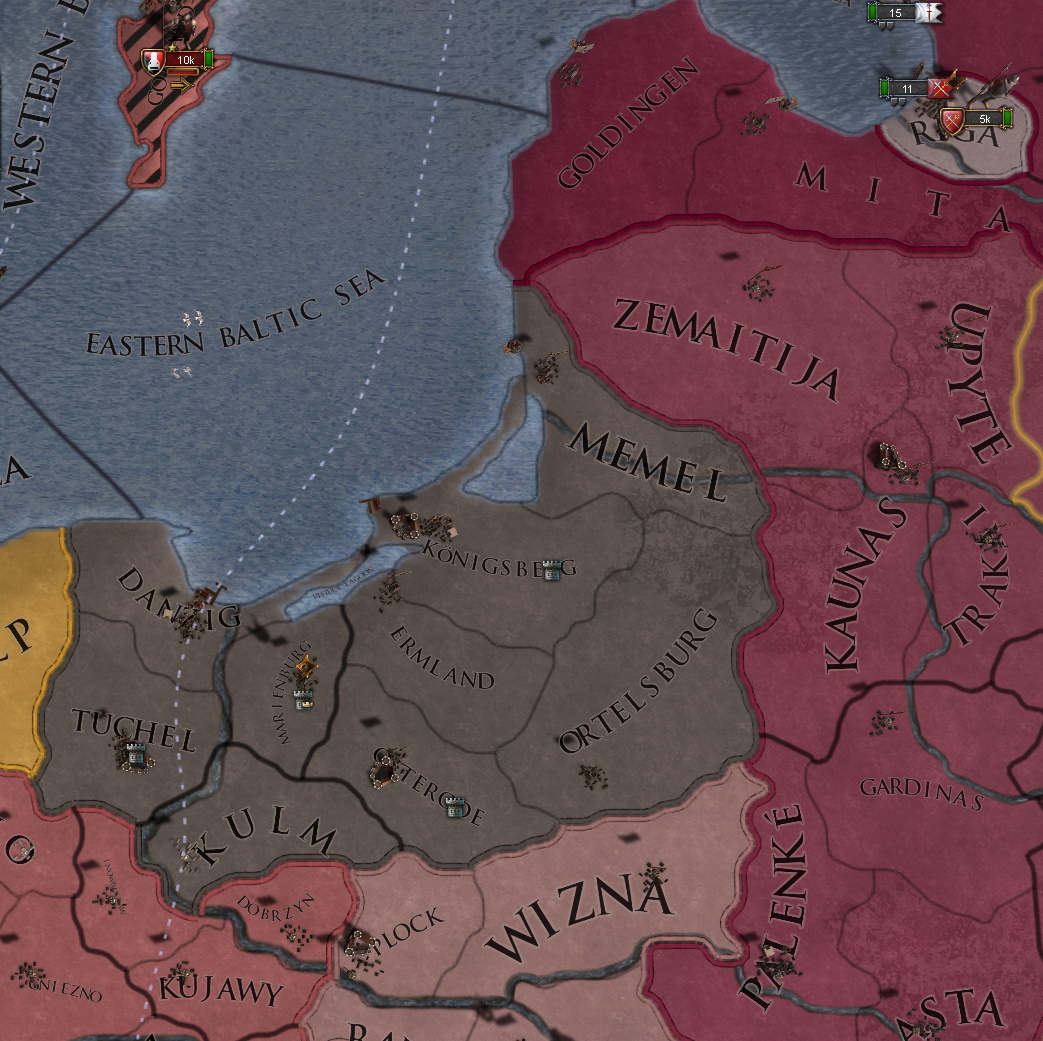
In game representation of the eastern baltic sea region
So EU4 creates a significantly upscaled view for the player.
With our goal established we’ll first explore previous methods that I and other developers have used to simulate EU4’s maps (and other games by Paradox Development Studio like Hearts of Iron, Crusader Kings, and Victoria).
Pixels
The most intuitive approach, which I’ll call the pixel approach, is to take the raw, province color coded image and fill each province appropriately to create a bitmapped image. This is how the map was previously architected in Rakaly as well as the community made Map Viewer and Savegame Editor. There are a significant amount of APIs and libraries for working with pixel images, so one can get quite far with this strategy and produce an image like so:
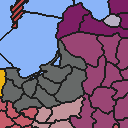
Provinces filled with some province border detection
But most would agree that the image is too small for all use cases, so we need to scale it up. Let’s see what 3x scale produces.
By default the browser will produce a blurry image:
Blurry image scaled with bilinear interpolation
How browsers upscale images is implementation specific, but by default, firefox uses bilinear interpolation which is better suited for photography. Thankfully, the web exposes alternative image scaling algorithms through image-rendering, and we can select the crisp-edges value to preserve the necessary contrast.

Pixelated image scaled with nearest neighbor
The pixelated image is satisfactory for some but leaves enough to be desired for others to seek alternative methods.
In summary:
The good:
- Easiest to implement
- API and library support
- Simplicity of this approach often aids performance
The bad:
- Inferior scalability
Vector
Neither scaled image looks great. Many abandon the pixel base approach and reach for the next tool: vector graphics. A big stumbling block is deriving an algorithm that will convert the game images to a vector equivalent. Vector tools can’t handle this out of the box as evident by this Graphic Design question.
But there are successful projects that use this approach:
- Skanderbeg: based on geojson and leaflet
- PDXGA: uses geojson with echarts
- eu4-svg-map: pure svg
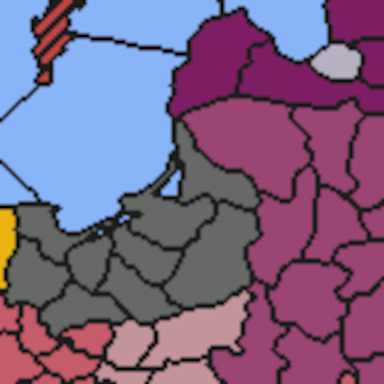
Below is an example of how Skanderbeg (and similarly PDXGA) renders the region in question.
Skanderbeg render of the EU4 map with vector graphics
Nice, infinitely scalable. Using geojson has its benefits too as then one can leverage that ecosystem (eg: leaflet and echarts), which handle a lot of user interaction (pan, zoom, etc).
There are some downsides that I don’t think have been solved with this vector graphic implementation. Each province is represented by a path. All borders between provinces are drawn twice, one by each province. The issue with this is that one can’t manipulate borders between provinces, for instance if one wanted to preserve only borders between countries or coastlines and remove intracountry province borders. While it is possible to create an SVG with each province being a group of borders we run into increased difficulties manipulating individual provinces in their entirety in addition to needing 20,000 path segments, which I imagine would get unwieldy. The other problem with vector implementations is that they tend to emphasize sharp edges when compared to our goal image.
But to prove me wrong is a more advanced implementation: eu4-svg-map, which overlays a couple of background images on top of an svg and this svg even includes the name of the country!
EU4 SVG project’s rendition with vector graphics
Due to compression artifacts, it’s hard to make out that the above SVG contains both province and country level borders.
Overall very polished – hard to believe it’s an SVG, but it is. And with 20,000 paths you would be right deducing that every border between provinces is a separate path. Forgetting text for a moment, it’s straightforward to re-assign a province to a different owner through toggling the province’s path class name to the desired country tag and relocating path segments representing borders in the DOM, as the parent element determines the thickness of a border (thick for country border, thin for province border – province paths by themselves do not contain border styles).
All this means is that it should be technically feasible to change the map mode (eg: from political to religious) close to real time (< 3 seconds) while recalculating borders. All it would take is changing the DOM class names on 5,000 provinces and DOM location of up to 15,000 border paths. So 20,000 DOM operations is our ceiling. Seems doable for browsers to do in a few seconds, as the SVG only takes 500ms to be constructed on load. May take some time to tease out all the performance, though.
What’s wrong? Well nothing really. The author does have a small writeup about their experience, and it kinda appears that they are running up against some limits with SVG trying to replicate more nuanced border logic and browser SVG text implementation differences. Doesn’t seem like a deal breaker. Looking at the code, there’s a lot of work that went into generating this SVG. Like there’s a class dedicated to tracing and categorizing rivers. A quick tally shows about a few thousand lines to generate the SVG. To be honest I was expecting more. Wrap the SVG in a component that allows pan and zoom, and you basically have yourself a finished project! Truly well done.
In summary:
The good:
- Infinite scalability
- Can leverage geojson and svg ecosystem
The bad:
- Custom bitmap tracing code
- Difficulty in creating output that resembles the game
- Limitations of output format
- Since implementations vary wildly, performance may be tough to achieve
WebGL
If you’ve followed earlier links on image rendering properties then you’ll have noticed a mention that browsers support a type of pixel art scaling (emphasis mine):
crisp-edges: Suitable algorithms include nearest-neighbor and other non-smoothing scaling algorithms such as 2×SaI and hqx-family algorithms
And when hqx is used, the output is fantastic: no blurriness and no pixelation.

Result if browsers used the hqx pixel-art scaler
Unfortunately, the chosen scaling algorithm is non-deterministic (and I’ve never gotten an hqx-like output) and chrome does not support the crisp-edge value. So we’ll need to implement it ourselves.
The issue with implementing our own pixel scaling algorithm is that it is not well suited for the CPU for real time processing. If the raw color coded image is 5632x2048, upscaling by 3x would result in over 100 million pixels, which gets close to half a billion bytes (RGBA32). This sounds too much for even my finely tuned (albeit single-threaded) WASM implementation, which calculates the indexed color at 1x scale in 60ms (~150ms with edge detection).
If one has more lax performance requirements then CPU implementations of pixel art scaling algorithms are available like xBRZ or one of its ports. Since performance is key and pixel art scalers are implemented on the GPU, we turn to the GPU.
So earlier this year I tried teaching myself WebGL in a span of a week, but ultimately hit a wall in understanding, so I wrote about my tribulations, and Christopher, the developer behind Pdx-Unlimiter, a toolbox for Paradox grand strategy games, reached out and offered to team up. While they designed and wrote the GLSL source code, I glued everything together with javascript. After a couple months we reached what I would consider to be the best (or the potential to be the best) emulation of EU4’s map.
Render with WebGL
Before getting into how it’s done, first a summary:
The good:
- Achieves closest resemblence to game render
- Best performance: 0.1ms to redraw entire scene (so GPU is 600x faster than the prior implementation)
- Everything is workaroundable
The bad:
- WebGL learning curve
- Reimplement interactions: pan, zoom, tooltips
Implementation
We use WebGL2 over the original for ease of use. We’ll be working with arrays of data and using the WebGL2-only texelFetch to index into them. And with 2% of our traffic coming from Safari devices, which don’t support WebGL2 (but will receive support in Safari 15), there’s very little reason for us to not use WebGL2.
Conceptually the implementation works by first generating our map at 1x resolution with provinces colored and borders drawn. Then through a framebuffer the output is piped to our pixel art scaler with terrain overlaid on top. Overall, the shaders are composed of around 600 lines of code. No 3rd party WebGL wrapper libraries used either.
Looking at the steps of the first shader:
- Start with raw color coded province image, which we’ll look at pixel by pixel
- Take each pixel and find the index of where that RGB value occurs in a sorted array of RGB values of the raw provinces. This means there’s a pre-processing step where this sorted array is prepared ahead of time. We want it sorted so that we can binary search through the list. The exact sorting algorithm doesn’t matter as long as you’re consistent – we sort by the red channel, then green, and finally blue in ascending fashion.
- Our index is then plugged directly into an array to find out the primary color the province has been assigned. The index is used again for the secondary color (eg: for when the province is occupied)
- Borders are determined if any neighboring pixels are a different color (raw color for province borders and primary color for country borders)
In graphical form, we examine a pixel:
Zoomed (20x) example of a pixel and its neighbors being examined
And look it up to find it’s primary color:
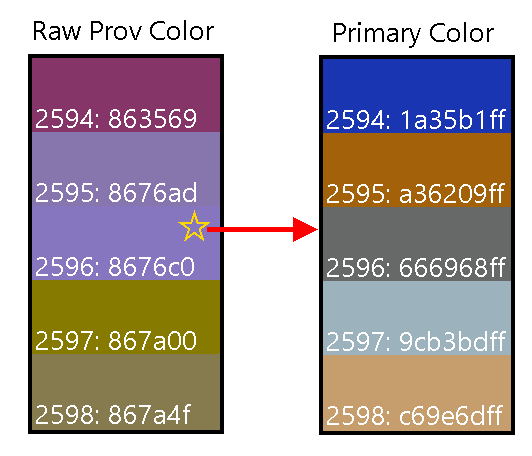
Search for pixel in sorted array
The fact that provinces have an ID is often a source of confusion. The algorithm and what is pictured above are not using province IDs – it’s the index of the sorted color array.
The output of the first stage will look awefully close to the pixel implementation.
Output from stage 1
Except the eagle eyed among you may have noticed the above image has partially transparent water. Don’t be fooled, there’s lots of activity going on underneath the surface:
- The alpha is a result of smuggling the deduced terrain of the pixel (ie: water / impassable terrain) as unique alpha values for the next stage.
- The terrain is deduced by examining RGB value of the terrain pixel art from the game files. Be warned that extrapolating the terrain of pixels to the terrain of a province is an effort in frustration, so when getting fancy with terrain, consider yet another array lookup.
- In other map modes (like religious) where province colors don’t have anything to do with country colors, we need an array for country colors in order to draw country borders.
- We exclude borders between adjacent water provinces as those are rarely useful. Not sure what border algorithm Paradox uses, but apparently it’s the majority of the frame time in game.
- There’s actually two outputs from stage 1, the one posted above is for post processing and the other is nearly the same except it has the alpha values fully turned on and there’s some color changes to water, impassable terrain, and the stripes for provinces where primary and secondary colors differ.
Onto stage two:
- Half of stage two is dedicated to the pixel art scaler which is complicated enough to make my eyes glaze over – so we skip it. I suggest reading an appropriate tutorial. For instance, the author of xBR wrote a tutorial on how it works. Though the most accessible guide I’ve found is from the newest pixel art scaler (announced in 2021), MMPX. They have a lovely paper that documents and compares it to the other algorithms mentioned throughout this post. There’s also a website for you to test out the differences in scaling algorithms!
- The other half is post processing where we incorporate the game’s normal map and are on the lookout for smuggled alpha values. If we detect an alpha value that represents a water pixel we overlay a couple of game water textures, taking into account how far the user has zoomed so we know which sea texture should dominate. How far a user has zoomed is useful for other calculations so that we can sprinkle in textures for eye candy. Other than that, a few additional textures are blended into the output to aid realism.
I feel like game developers would find our implementation rather mundane, and non-game developers skipped this section as it’s not exactly easygoing.
The other problem is user interaction. Our goal became to mimic Google Maps as that is the design people find most intuitive. We had to hook everything up with DOM events ourselves: implement panning by listening on mousedown and mousemove, zooming with wheel, selection with mouseup, and other interactions such as hover and double clicking. To be clear none of these are particularly hard to implement – just something that needs to be done. Given a world where I need to code this and one where I don’t, I prefer the one where I don’t.
As far as user controls, those can be easily coded in the web framework du jour and overlaid on top of the map.
Lessons Learned
Color Profiles
The raw color coded province image is a 33MB BMP image. Too big. So we use imagemagick convert to get a sub-500KB PNG. The output image would look the same and even contain the same pixel values when examined in GIMP or Paint.NET. However, once in the browser, every pixel color would be off by a byte or two (verified by dumping canvas data), which is enough to throw everything off. Cue a couple hours of head scratching until we exposed image properties:
identify -verbose provinces.bmp | grep intent
  Rendering intent: Perceptual
A perceptual intent gives the impression that the image renderer (the browser) is free to modify individual colors at its convenience as long as the result looks about the same. This is not what we want.
The fix is to change or remove the intent. Since we don’t want any metadata attached to the image anyways, we can -strip which will remove color profiles.
convert provinces.bmp -strip PNG32:provinces.png
I have enough passing familiarity with BMP images to have written a decoder, and I don’t recognize anywhere in the BMP format where one defines a rendering intent. Interestingly enough changing the profile to be absolute via:
convert provinces.bmp -profile absolute provinces2.bmp
Changes 4 bytes in 4 different locations. So something is happening to convey the color profile. An investigation for another day.
Performance
While CPU performance (especially single threaded performance) has not changed drastically in the last decade, the same can’t be said for GPUs. My older ultrabook’s integrated GPU (Intel HD 4400) is 20x slower than my desktop GTX 1070 (a card that is over 5 years old).
Despite the performance chasm, a couple years ago I was playing EU4 on the integrated GPU in a pinch, which is a testament to the game that it could actually run given the constraints. Mind you, EU4 didn’t run well, but it did run well enough to play. So while I don’t daily drive the ultrabook anymore, I decided to use it for testing, as my philosophy is that if a system can run EU4 it should be able to run our map.
And I’m happy to report that the map can render on old integrated GPUs. Panning and zooming around the map with all the terrain post processing gives horrible stutters, but it has improved greatly since the initial implementation, as it gave us performance optimization ideas like allowing the user to disable post processing.
Render without terrain for improved performance
We’ve progressed to the point where I’m happy with the performance considering just visiting the homepage of WebGL2 Fundamentals on the ultrabook is stuttery and causes 100% CPU usage.
Undefined Behavior is Undefined
Before being refactored, we used to have a shader function that took a default value and re-assigned it as needed:
vec3 postProcess(vec2 tc) {
  float alpha = 1.0;
  myFn(alpha);
  // ...
}

void myFn(out float alpha) {
  return;
}
On some machines the output looked good, others received a black image.
In the above, myFn does not assign alpha so according to the wiki its assigned value is undefined:
Note that the initial value of the parameter at the start of the function being called is undefined, just as if one had simply created a local variable.
So in some implementations, alpha is assigned the passed in argument (1.0) while others are assigned to 0.0.
The fix is simple.
-void myFn(out float alpha) {
+void myFn(inout float alpha) {
Workarounds
One of things that I’ve learned is that there are workarounds for the problem one encounters with WebGL.
- Can’t transfer data from
gl.readPixelsto a 2d canvas due to flipped coordinate system? Change the shader to accept an argument to flip itself around. - Can’t export a 3x scaled map due to it exceeding the max texture size of 16384? Chop the rendering up, zoom into each section, and stitch the pieces back together onto a temporary canvas. Though funny enough, I had to revert this change due the render changing the resulting texture blend based on the zoom level. The fix for this? Introduce another parameter to have the shader assume an unzoomed render.
- Creating WebGL UI or text? Just overlay some HTML elements.
Future Improvements to First Content Paint
We’ll continue adding features and refine render performance, but one thing we could improve on is the time required to a first render.
On initialization there is a pause of anywhere between 400ms (top of the line hardware) and several seconds (old ultrabook) before the map is displayed. The UI thread is blocked during this time. Since we compile shaders and link programs in parallel and in the background, profiling showed 99.5% of the pause is due to instantiating textures from pre-loaded images. The images we’ve used thus far have been optimized with formats like webp to minimize network traffic. However, the recommendation for WebGL is to prefer GPU-friendly image codecs at the cost of heavier payloads.
Good candidates for GPU-friendly images are images in the WEBGL_compressed_texture_s3tc family, as even though that family isn’t supported on mobile, 90% of our traffic comes from desktops and laptops. I haven’t explored all the format options for exporting optimized DDS images but extrapolating from a few conversions would put the network payload nearing 20MB even after brotli encoding. That’s excessive for those without fast internet. At least the images are cached forever so subsequent loads should be instant. Who knows maybe it’s worth having progressive enhancement for first time loads: compile and render the terrain-less view while large assets are downloaded in the background.
An interesting note is that basis universal claims to solve both the compression and gpu-friendly problem while offering greater platform compatibility (it includes mobile GPUs). It’s definitely rough around the edges (no npm package, unclear web deployment instructions – like do I write some C code and use emscripten?), but nothing I saw that wasn’t fixable with time or community input.
Conclusion
Definitely a whirlwind tour where we saw various techniques used to render EU4’s map:
- Pixel: easy to implement but will have either scaling difficulties or performance issues when executing pixel art scaling on the CPU (the MMPX paper linked earlier lists some implementations nearly 1000x slower on the CPU – consuming over 100ns per pixel!)
- Vector: solves scalability, but has a high upfront cost with custom bitmap tracing logic and forethought to output a structure that is flexible, accurate, and performant
- WebGL: accuracy, performance, and scalability but has a steep learning curve and interactions have to be reimplemented
There is not one right implementation for every situation. I am however biased towards the pixel approach for quick or easy projects and a GPU-centric approach for projects requiring more perfection.
Comments
If you'd like to leave a comment, please email [email protected]