Robust systemd Script to Store Pi-hole Metrics in Graphite
Published on:Table of Contents
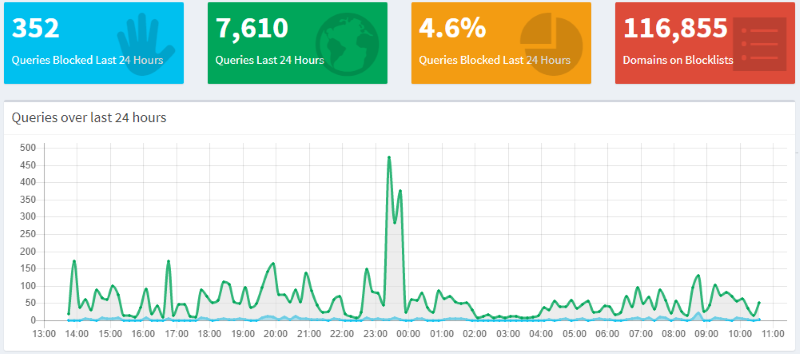
I’m building a home server and I’m using Pi-hole to blackhole ad server domains in a test environment. It’s not perfect, but works well enough. The Pi-hole admin interface shows a dashboard like the following to everyone (admin users get an even greater breakdown, but we’ll focus on just the depicted dashboard)

Pi-Hole Admin Dashboard
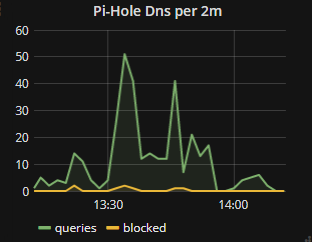
It’s a nice looking dashboard; however, it’s a standalone dashboard that doesn’t fit in with my grafana dashboards. I don’t want to go to multiple webpages to know the health of the system especially since I want to know two things: is pi-hole servicing DNS requests and are ads being blocked. This post will walk through exporting this data from pi-hole into Graphite, which is my time series database of choice.
There is a blog post that contains a python script that will do this process. Not to pick on the author (they inspired me) but there are a couple of things that can be improved:
- The python script is not standalone. It requires the requests library. While ubiquitous, the library is not in the standard library and will require either a virtual environment or installation into the default python
- Any error will crash the program (eg connection refused, different json response, etc) and it’ll have to be manually restarted
- No logs to know if the program is running or why it would have crashed
- Does not start on computer reboot
An Alternative
Let’s start with making a network request:
curl http://$HOST:$PORT/admin/api.php?summaryRaw
returns
{"domains_being_blocked":116855,"dns_queries_today":8882 ... }
Ah, let’s turn to jq to massage this data, which will, by default, prettyify the output
{
  "domains_being_blocked": 116855,
  "dns_queries_today": 8882,
  "ads_blocked_today": 380,
  "ads_percentage_today": 4.278316,
  "unique_domains": 957,
  "queries_forwarded": 5969,
  "queries_cached": 2533,
  "unique_clients": 2
}
We somehow need to get the previous data into the <path> <value> <timestamp> format for carbon with lines seperated by newlines.
Since jq prefers working with arrays, we’ll transform the object into an array: jq 'to_entries'
[
  {
    "key": "domains_being_blocked",
    "value": 116855
  },
  {
    "key": "dns_queries_today",
    "value": 8954
  },
  // ...
]
Now we’re going to transform each element of the array into a string of $key $value with jq 'to_entries | map(.key + " " + (.value | tostring))'. Value is numeric and had to converted into a string.
[
  "domains_being_blocked 116855",
  "dns_queries_today 8966",
  "ads_blocked_today 385",
  "ads_percentage_today 4.294",
  "unique_domains 961",
  "queries_forwarded 6021",
  "queries_cached 2560",
  "unique_clients 2"
]
Finally, unwrap the array and string with a jq -r '... | .[]' to get:
domains_being_blocked 116855
dns_queries_today 9005
ads_blocked_today 386
ads_percentage_today 4.286508
unique_domains 962
queries_forwarded 6046
queries_cached 2573
unique_clients 2
We’re close to our desired format. All that is left is an awk oneliner:
awk -v date=$(date +%s) '{print "pihole." $1 " " $2 " " date}' >>/dev/tcp/localhost/2003
So what does our command look like?
curl --silent --show-error --retry 5 --fail \
       http://$HOST:$PORT/admin/api.php?summaryRaw | \
    jq -r 'to_entries |
           map(.key + " " + (.value | tostring)) |
           .[]' | \
    awk -v date=$(date +%s) '{print "pihole." $1 " " $2 " " date}' \
    >>/dev/tcp/localhost/2003
Is this still considered a one-liner at this point?
I’ve add some commandline options to curl so that all non-200 status codes are errors and that curl will retry 5 times up to about a half a minute to let the applications finish booting.
We could just stick this in cron and call it a day, but we can do better.
systemd
systemd allows for some nice controls over our script that will solve the rest of the pain points with the python script. One of those pain points is logging. It would be nice to log the response sent back from the API so we’ll know what fields were added or modified. Since our script doesn’t output anything, we’ll capture the curl output and log that (see final script to see modification, but it’s minimal).
With that prepped, let’s create /etc/systemd/system/pihole-export.service
[Unit]
Description=Exports data from pihole to graphite

[Service]
Type=oneshot
ExecStart=/usr/local/bin/pi-hole-export
StandardOutput=journal+console
Environment=PORT=32768
Type=oneshot: great for scripts that exit after finishing their jobStandardOutput=: Has the stdout go to journald (which is indexed, log-rotated, the works). Standard error inherits from standard out. Read a previous article that I’ve written about journaldEnvironment=PORT=32768: sets the environment for the script (allows a bit of configuration)
After reloading the daemon to find our new service, we can run it with the following:
systemctl start pihole-export

# And look at the output
journalctl  -u pihole-export
If we included an exit 1 in the script, the status of the service would be
failed even though it is oneshot and the log file will let us know the data
that failed it or if there was a connection refused (printed to standard
error). This allows systemd to answer the question “what services are currently
in the failed state” and I’d imagine that one could create generic alerts off
that data.
One of the last things we need to do is create a timer to be triggered every minute.
[Unit]
Description=Run pihole-export every minute

[Timer]
OnCalendar=*-*-* *:*:00
AccuracySec=1min

[Install]
WantedBy=timers.target
It might annoy some people that the amount of configuration is about the same number of lines as our script, but we gained a lot. In a previous version of the script, I was preserving standard out by using tee with process substitution to keep the script concise. This resulted in logs showing the script running every minute, but the data in graphite only captured approximately every other point. Since I knew from the logs that the command successfully exited, I realized process substitution happens asynchronously, so there was a race condition between tee finishing and sending the request. Simply removing tee for a temporary buffer proved effective enough for me, though there reportedly are ways of working around the race condition.
Final script:
#!/bin/bash
# Script to stop immediately on non-zero exit code, carry exit code through
# pipe, and disallow unset variables
set -euo pipefail

OUTPUT=$(curl --silent --show-error --retry 10 --fail \
       http://localhost:$PORT/admin/api.php?summaryRaw)
echo $OUTPUT
echo $OUTPUT | \
    jq -r 'to_entries |
           map(.key + " " + (.value | tostring)) |
           .[]' | \
    awk -v date=$(date +%s) '{print "pihole." $1 " " $2 " " date}' \
    >>/dev/tcp/localhost/2003
Let’s review:
- New script relies on system utilities and jq, which is found in the default ubuntu repo.
- Logging output into journald provides a cost free debugging tool if things go astray
- Anything other than what’s expected will cause the service to fail and notify systemd, which will try it again in a minute
- Starts on computer boot
Sounds like an improvement!
Grafana
Now that we have our data robustly inserted into graphite, now to time to graph it! The two data points we’re interested in are dns_queries_today and ads_blocked_today. Since they are counts that are reset after 24 hours, we’ll calculate the derivative so we can get a hitcount.

Pi-Hole panel in Grafana
alias(summarize(nonNegativeDerivative(keepLastValue(pihole.dns_queries_today)),
	'$interval', 'sum'), 'queries')

alias(summarize(nonNegativeDerivative(keepLastValue(pihole.ads_blocked_today)),
	'$interval', 'sum'), 'blocked')
The best part might just be that I can add in a link in the graph that will direct me to the pi-hole admin in the situations when I need to see the full dashboard.
Comments
If you'd like to leave a comment, please email [email protected]
This is a fantastic tutorial and your shell script is so simple and powerful. Thanks for sharing!