Replacing Elasticsearch with Rust and SQLite
Published on:Table of Contents
Caveat: Elasticsearch is a multi-purpose, distributed, battle-tested, schema-free, log and document storage engine. We’ll be replacing it with a single-purpose, relational schema, me-tested, and custom nginx access log storage engine. Knowing that, let’s begin.
After building my home server, I started hosting many sites through Docker containers – using nginx as a reverse proxy, so that I could apply Let’s Encrypt certificates and have unified logging. This provides a test-bed for new technologies before graduating them to a cloud provider. Everything works great, but I need insight into all those web requests:
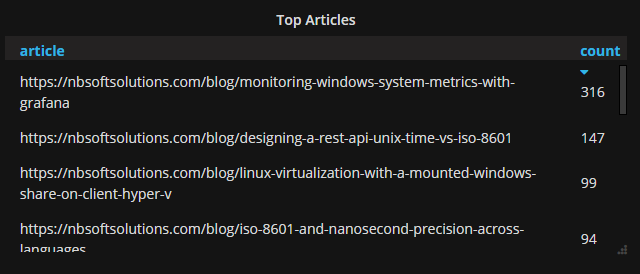
- What are my most popular blog articles? This will let me know what readers (or Google) is interested in and I can better expound on that article. Previously checking hits required me to proactively log onto the web server and execute a homegrown one-liner against access logs. It worked, but the drudgery would cause me to miss when an article went viral (if it ever did)
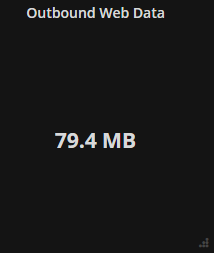
- How much outbound web traffic, which is not destined for myself, left the server. I do not have an unlimited upload capacity, so I need to ensure outbound web traffic is monitored. Since nginx only encompasses web traffic, this metric is best used to complement general network metric collection tools like collectd. The reason I’m excluding my IP from the data is that I’m assuming that Comcast won’t charge me for traffic that needs to be routed to myself.
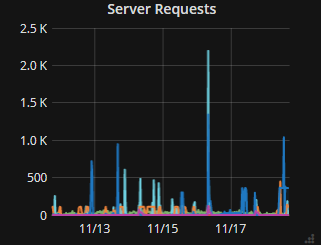
- Number of requests served for each virtual host. Even if my IP is included in the data it gives me a sense of how chatty a site is – potentially expediting its graduation to the cloud.
I eschewed front-end analytic packages like Google analytics or Piwik, as I don’t require user tracking and I don’t want an extra script users have to download. Additionally, I’m cautious of Google analytics for the privacy of my visitors. Thus, I’m sticking to access logs until there is money tied to understanding the users or visitors a site, in which case, Piwik would be the front runner.
Log Format
Before we get too far, the log format of my nginx has "$host" appended to the default combined log format defined by nginx. This allows me to see the hostname of the request (eg. test.example.com, git.example.com, etc). Since this deviates from the default, we’ll see how this makes life difficult.
log_format vhost    '$remote_addr - $remote_user [$time_local] '
                    '"$request" $status $body_bytes_sent '
                    '"$http_referer" "$http_user_agent" "$host"';
We’ll write a log parser that will only parse this custom format, so unfortunately, most other formats will be nonconforming and fail to parse, but techniques used are generic enough to be applicable in a wide range of situations.
Attempts
I did not initially plan on writing any code as I sought existing solutions.
GoAccess is a great first attempt. I recommend it for those who need to check access logs on the commandline. While it does contain a web dashboard, I found it lacking in visualizations and the ability to drill down into the data. When it comes to visualizations, Grafana has spoiled me. From here on out, we’ll focus on getting our analysis through Grafana.
Grafana supports several types of datasources, InfluxDB being one of them. I had high hopes that Influx and the telegraf logparser would give me what I want, but since InfluxDB does not support GROUP BY queries on fields, almost all the interesting tidbits found in the access logs couldn’t be grouped. Thus, I couldn’t calculate page counts and had to seek alternative datasources.
After searching, most signs pointed to Elasticsearch for log storage and management. Elasticsearch can ingest logs directly from Beats, which saves us from an intermediate Logstash server. Setting up Beats to parse the access log correctly was troublesome due to my nginx log format. Since the format is not the default, I required a temporary Kibana install to delete certain structures that are automatically set up in Elasticsearch. It was a dance with forum posts and Beats module configs that have left a sour taste in my mouth. Despite obstacles, this setup delivered and offered the insights desired:

Top articles on this blog

Outbound data to external IPs

Virtual hosts and number of requests served
Why write this post?
At idle, Elasticsearch uses:
- 1GB of RAM (out of 8GB total)
- 30% utilization of a CPU
- 1GB of Disk space after a week
This doesn’t sound bad, but considering this server houses a dozen containers and the next CPU intensive container uses only 2% of a CPU – Elasticsearch is too heavy. For a server that gets 15 requests a minute, the resource consumption of Elasticsearch doesn’t justify it’s use. What would happen if I received a spike of traffic? I feel like the server would fall over not because the app couldn’t handle it, but log management couldn’t handle the load.
Setting a memory limit on the container of 500MB of RAM only increased CPU usage as Elasticsearch spent most of it’s time garbage collecting – what – I’m not sure as the system was idle. An example of this is a warning from Elasticsearch when memory limit was even set to 850MB for the container (and ES_JAVA_OPTS=-Xms425m -Xmx425m)
[o.e.m.j.JvmGcMonitorService] [R5vVQEc] [gc][541919] overhead, spent [1.9s] collecting in the last [2.8s]
My mind is boggled. No wonder elastic cloud starts their pricing for production Elasticsearch at 4GB of RAM and 96GB of storage. It’s a RAM eating machine and I was a penny pincher when buying RAM.
Elasticsearch is a Corvette and all I need is a toy car.
Parsing with Rust
Upon reflection, I realized a simple SQLite table would store all the information I wanted. I could have used a small Python script to ingest the logs, and I would recommend this approach for anyone who needs to get the job done now. I, on the other hand, wanted to an excuse to write a Rust program that emphasizes minimal allocations and cpu usage.
Extracting information from the access logs is straightforward thanks to the regex crate:
lazy_static! {
    static ref RE: Regex = Regex::new(r#"(?x)
    (?P<remote_addr>[^\s]+)
    \s-\s
    (?P<remote_user>[^\s]*)
    \s\[
    (?P<time_local>[^\]]+)
    \]\s"
    (?P<method>[^\s]+)
    \s
    (?P<path>[^\s]*)
    \s
    HTTP/(?P<version>[^\s]+)"
    \s
    (?P<status>[^\s]+)
    \s
    (?P<body_bytes_sent>[^\s]+)
    \s
    "(?P<referer>[^"]*)"
    \s
    "(?P<user_agent>[^"]*)"
    \s
    "(?P<host>[^"]+)""#).unwrap();
}
Benchmarks show that the extraction into a struct takes 7.5 microseconds.
Thanks to Rust, the struct’s fields and the regex capture groups point to locations in the original string from the access log, called string slices. This means that no additional allocations are needed when parsing and persisting a log line as diesel will take the same string slices and insert them into the database. I find this absolutely fascinating. Due to lifetimes in Rust, the compiler knows that original log line outlives the regex capture groups and the struct, so they are free to reference sections.
As a result, parsing and insertion code look strikingly elegant and contains zero allocations excluding error paths.
match parser::parse_nginx_line(l.as_str()) {
    Ok(ng) => {
        // If we can't insert our parsed log then our schema must not be representative
        // of the data. The error shouldn't be a sqlite write conflict as that is
        // checked at the transaction level, but since I'm not all-knowing I won't
        // assume the cause of the error. Instead of panicking, discard the line and
        // log the error.
        if let Err(ref e) = diesel::insert(&ng).into(logs::table).execute(conn) {
            error!("Insertion error: {}", e)
        }
    }

    // If we can't parse a line, yeah that sucks but it's bound to happen so discard
    // the line after it's logged for the attentive sysadmin
    Err(ref e) => error!("Parsing error: {}", e.display_chain()),
}
Since access logs are continuously written to and rotated every day, I wasn’t looking forward to solving the “following the log file” problem. There’s not a package in Rust to follow files. Contrast that with Go. It’s easy enough to continuously read from a file, but rotation would be vexing, and I’m ignorant to all the nuances in such a situation. The solution turned out to be simple: tail -n 0 -F access.log | ./rrinlog. Offload the tailing to a battle proven application and simply ingest the log through stdin.
Results
I deployed the executable (called rrinlog) and let it run. After some time, I checked stats given to us by systemd.
  rrinlog.service - Parses nginx access logs into a sqlite database
   Loaded: loaded (/etc/systemd/system/rrinlog.service; static; vendor preset: enabled)
   Active: active (running) since Sun 2017-11-05 20:31:16 CST; 17h ago
 Main PID: 10602 (bash)
    Tasks: 3
   Memory: 8.9M
      CPU: 2.625s
   CGroup: /system.slice/rrinlog.service
           ├─10602 /bin/bash -c /usr/bin/tail -n 0 -F /var/log/nginx/access.log | RUST_LOG=info ./rrinlog
           ├─10603 /usr/bin/tail -n 0 -F /var/log/nginx/access.log
           └─10604 ./rrinlog
- 8.9MB is a 100x reduction in memory usage
- 2.625s of CPU usage over 17hours translates into 0.004% CPU usage (realm of 1000 - 10000x CPU reduction)
- 100x reduction in disk usage
So far so good.
Grafana and Rust
While Grafana has built in Elasticsearch capabilities it does not currently support queries on a SQLite database. I’m hoping for Grafana to support SQLite as a datasource like it does Postgres and Mysql. Until that day, I need to utilize the simple json datasource, which will require us to create web service that adheres to the API; therefore, I set out to create rrinlog-server
Are we web yet? gives a list of frameworks and resources for Rust. I chose Rocket (now actix-web, see why. This article is still up to date for Rocket) as it has the best testing story, serde support, and contained minimal boilerplate. The downside is that nightly Rust is required. A close contender was tk-http, which offers significantly more control, is on stable Rust, and supports asynchronous requests. Since none of those items are imperative, Rocket was chosen.
This is an actual JSON endpoint. It’s so succinct.
#[post("/search", format = "application/json", data = "<data>")]
fn search(data: Json<Search>) -> Json<SearchResponse> {
    debug!("Search received: {:?}", data.0);
    Json(SearchResponse(vec![
        "blog_hits".to_string(),
        "sites".to_string(),
        "outbound_data".to_string(),
    ]))
}
The test code is longer than the method but concise as well:
let mut response = client
    .post("/search")
    .body(r#"{"target":"something"}"#)
    .header(ContentType::JSON)
    .dispatch();

assert_eq!(response.status(), Status::Ok);
assert_eq!(response.content_type(), Some(ContentType::JSON));
assert_eq!(
    response.body_string(),
    Some(r#"["blog_hits","sites","outbound_data"]"#.into())
);
A good testing story is important for rrinlog-server partly because Rocket requires Rust nightly, which has notably fewer guarantees about breaking changes than stable. Integration tests for rrinlog-server hit an actual SQLite database via the HTTP endpoint and assert that everything went well. This will give me the confidence to upgrade dependencies without interactively testing every update. Though this is a small project, the time spent on tests will be worth it after long breaks in development.
More Diesel
The SQL queries executed by the server aren’t crazy, but it appears that diesel can’t flex it’s magic everywhere. Below is the SQL query to grab the top articles in a given time frame.
SELECT referer,
       Count(*) AS views
FROM   logs
WHERE  host = 'comments.nbsoftsolutions.com'
       AND method = 'GET'
       AND path <> '/js/embed.min.js'
       AND epoch >= ?
       AND epoch < ?
       AND referer <> '-'
       AND remote_addr <> ?
GROUP  BY referer
ORDER  BY views DESC
This query can’t be represented in Diesel’s DSL (a sample of the DSL is demonstrated in Diesel’s getting started). Diesel supports custom queries and thankfully, it’s not onerous.
// Take the SQL string posted earlier and bind params.
pub fn blog_posts(
    conn: &SqliteConnection,
    range: &Range,
    ip: &str
) -> QueryResult<Vec<BlogPost>> {
    let query = sql::<(Text, Integer)>(BLOG_POST_QUERY)
        .bind::<BigInt, _>(range.from.timestamp())
        .bind::<BigInt, _>(range.to.timestamp())
        .bind::<Text, _>(ip);
    LoadDsl::load::<BlogPost>(query, conn)
}
It’s a shame that Diesel only returns vectors and not iterators. Considering a database query can return a large number of hits – a vector could put unnecessary pressure on the memory allocator.
These small smudges on Diesel’s API shouldn’t sway anyone against it.
Units of Measure
Coming from an F# background where units of measure are built into the compiler, I saw the use of the Rust library, dimensioned, as a boon.
Grafana gives the interval between datapoints in milliseconds. I store data in SQLite as epoch seconds. I often had to stop and remember if I was working with seconds or milliseconds. With units of measure I can change the function to incorporate the assumed units in the arguments:
fn fun(interval_s: 32) { }

// vs.

fn fun(interval: Second<i32>) { }
Now if I forget to pass in seconds, I get a compiler error! The cost of dimensioning input as soon it arrives is pretty low
// If grafana gives us an interval that would be less than a whole second,
// round to a second. Also dimension the primitive, so that it is obvious that
// we're dealing with seconds. This also protects against grafana giving us a
// negative interval (which it doesn't, but one should never trust user input)
let interval = Second::new(max(data.0.interval_ms / 1000, 1));
I do wish it was more ergonomic to cast the units away, for situations that require it (like database queries).
fn fun(interval: Second<i32>) {
    let interval_s: i32 = *(interval / Second::new(1));
}
Results
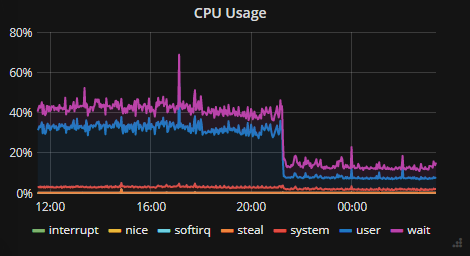
When all said and done, what does CPU usage look like? To give you an idea, I switched over to rrinlog and rrinlog-server and turned off elasticsearch. I’ll let you guess when I made the switch:

CPU usage without ElasticSearch
I can confidently say that this project has already been a success:
- Stumbled across GoAccess and will be looking to use that for viewing logs at the terminal
- Understood InfluxDB’s distinction between tags and fields. One needs to put careful thought about what their schema looks like to provide the insight without an explosion of cardinality
- Tested what it was like to self host Elasticsearch, insert data, and perform queries in Kibana
- Wrote CLI Rust app (
rrinlog) using regex, Diesel, and SQLite that emphasizes zero allocation and robustness - Wrote Rust web app (
rrinlog-server) using Rocket and Diesel that adheres to the Grafana JSON api.
All of these aspects I was unfamiliar with and this project presented a great learning experience. The drastic improvement in resource consumption is just an added bonus!
What’s Next
Ideally, I’d like to be able to make my solution more generic and not force people to use the same log format. I fear making it too generic would come at a cost of performance. Maybe static analysis of nginx log format resulting in custom code could generated. Realistically, if I had users enter in an arbitrary regex with a minimum set of capture groups and tied it in with a Postgres database I could get the best worlds – generic at only a slight cost of performance and resource consumption. The added bonus is that rrinlog-server wouldn’t be needed as Grafana has builtin support for Postgres.
Elasticsearch has the ability to take an IP address and turn it into a location. This is called GeoIP. I had a Grafana panel showing the top visiting cities, which is novel but not critical to monitor. Migrating away from Elasticsearch meant I had to remove the visualization. I’m not sure how GeoIP works, but this may be something that I can add.
Before I forget and omit this, Elasticsearch has a rich query language for text queries. SQLite does too and it appears that Diesel will / does as well. Since I didn’t take advantage of full text queries in Elasticsearch, I didn’t worry about implementing them right away in rrinlog.
Comments
If you'd like to leave a comment, please email [email protected]
There are various geoIP modules, databases and API’s one can use to transform an IP address into a geo location.
Do you have a recommendation? If there is something out there that is straightforward to integrate into a rust code base, I’d love to add the feature. If not no worries, I’ll look into GeoIP integrations later.
You can pay for a MaxMind DB file that has many public APIs/libraries for reading that data.
Regarding InfluxDB, I would store the article (path) and other interesting tidbits as tags rather than a field, which would then allow you to group, filter, etc.
That’s true, an issue that I immediately see is that 404’s are written to the access log, so the cardinality would have no upper bound and would be easily exploitable. Filtering out non-200’s before inserting into InfluxDB definitely seems like a viable strategy. Thanks for the suggestion!
Great read. Thanks for sharing. I noticed you switched to Actix from Rocket - I’m curious you’re reasoning (I’m just getting started down the Rust/web path).
Yes, I forgot to link the follow up article: Migrating to Actix Web from Rocket for Stability