Guidelines on Benchmarking and Rust
Published on:Table of Contents
This post covers:
- Benchmark reports for contributors
- Benchmark reports for users
- Profiling with valgrind / kcachegrind
- Reproducible benchmarks and graphics
- Tips for benchmark behavior and benchmarking other languages
Lots of libraries advertise how performant they are with phrases like “blazingly fast”, “lightning fast”, “10x faster than y” – oftentimes written in the project’s main description. If performance is a library’s main selling point then I expect for there to be instructions for reproducible benchmarks and lucid visualizations. Nothing less. Else it’s an all talk and no action situation, especially because great benchmark frameworks exist in nearly all languages.
I find performance touting libraries without a benchmark foundation analogous to GUI libraries without screenshots.
This post mainly focuses on creating satisfactory benchmarks in Rust, but the main points here can be extrapolated.
Use Criterion
If there is one thing to takeaway from this post: benchmark with Criterion.
Never written a Rust benchmark? Use Criterion.
Only written benchmarks against Rust’s built in bench harness? Switch to Criterion:
- Benchmark on stable Rust (I personally have eschewed nightly Rust for the last few months!)
- Reports statistically significant changes between runs (to test branches or varying implementations).
- Criterion is actively developed
When running benchmarks, the commandline output will look something like:
sixtyfour_bits/bitter_byte_checked
                        time:   [1.1052 us 1.1075 us 1.1107 us]
                        thrpt:  [6.7083 GiB/s 6.7274 GiB/s 6.7416 GiB/s]
                 change:
                        time:   [-1.0757% -0.0366% +0.8695%] (p = 0.94 > 0.05)
                        thrpt:  [-0.8621% +0.0367% +1.0874%]
                        No change in performance detected.
Found 10 outliers among 100 measurements (10.00%)
  2 (2.00%) low mild
  2 (2.00%) high mild
  6 (6.00%) high severe
This output is good for contributors in pull requests or issues, but I better not see this in a project’s readme! Criterion generates reports automatically that are 100x better than console output.
Criterion Reports
Below is a criterion generated plot from one of my projects: bitter. I’m only including one of the nearly 1800 graphics generated by criterion, the one chosen captures the heart of a single benchmark measuring Rust bit parsing libraries across read sizes (in bits).
This chart shows the mean measured time for each function as the input (or the size of the input) increases.
Out of all the auto-generated graphics, I would consider this the only visualization that could be displayed for a more general audience, but I still wouldn’t use it this way. This chart lacks context, and it’s not clear what graphic is trying to convey. I’d even be worried about one drawing inappropriate conclusions (pop quiz time: there is a superior library for all parameters, which one is it?).
It’s my opinion that the graphics that criterion generates are perfect for contributors of the project as there is no dearth of info. Criterion generates graphics that break down mean, median, standard deviation, MAD, etc, which are invaluable when trying to pinpoint areas of improvement.
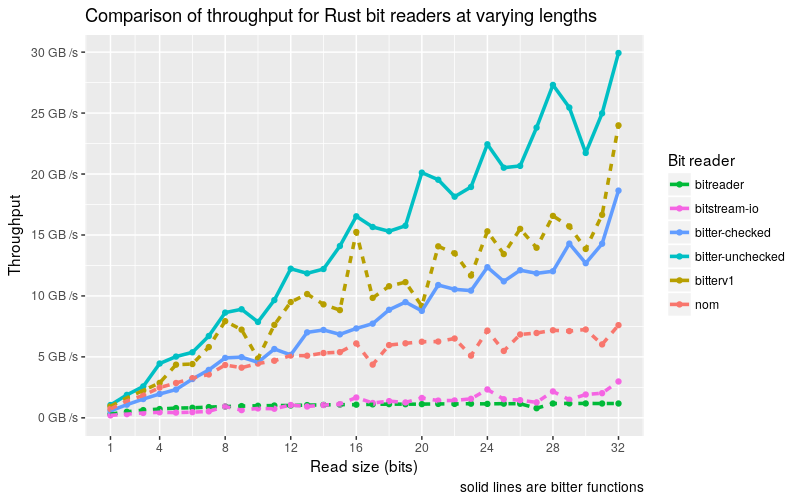
As a comparison, here is the graphic I created using the same data:

Creating our own visualization for better understanding
It may be hard to believe that the same data, but here are the improvements:
- A more self-explanatory title
- Stylistically differentiate “us vs them”. In the above graphic, bitter methods are solid lines while “them” are dashed
- More accessible x, y axis values
- Eyes are drawn to the upper right, as the throughput value stands out which is desirable as it shows bitter in a good light. It’s more clear which libraries perform better.
These add context that Criterion shouldn’t be expected to know. I recommend spending the time to dress reports up before presenting it to a wider audience.
Profiling and Criterion
Criterion does a great job comparing performance of implementations, but we have to rely on profiling tools to show us why one is faster than the other. We’ll be using the venerable valgrind, which doesn’t have a great cross platform story, so I’ll be sticking to linux for this.
# Create the benchmark executable with debugging symbols, but do not run it. We
# don't want valgrind to profile the compiler, so we have the "--no-run" flag. We
# also need debugging symbols so valgrind can track down source code
# appropriately. It blows my mind to this day that compiling with optimizations +
# debugging symbols is a thing. For so long I thought they were mutually
# exclusive.
RUSTFLAGS="-g" cargo bench  --no-run

# Now find the created benchmark executable. I tend to prefix my benchmark
# names with 'bench' to easily identify them
ls -lhtr ./target/release

# Let's say this was the executable
BENCH="./target/release/bench_bits-430e4e0f5d361f1f"

# Now identify a single test that you want profiled. Test identifiers are
# printed in the console output, so I'll use the one that I posted earlier
T_ID="sixtyfour_bits/bitter_byte_checked"

# Have valgrind profile criterion running our benchmark for 10 seconds
valgrind --tool=callgrind \
         --dump-instr=yes \
         --collect-jumps=yes \
         --simulate-cache=yes \
         $BENCH --bench --profile-time 10 $T_ID

# valgrind outputs a callgrind.out.<pid>. We can analyze this with kcachegrind
kcachegrind
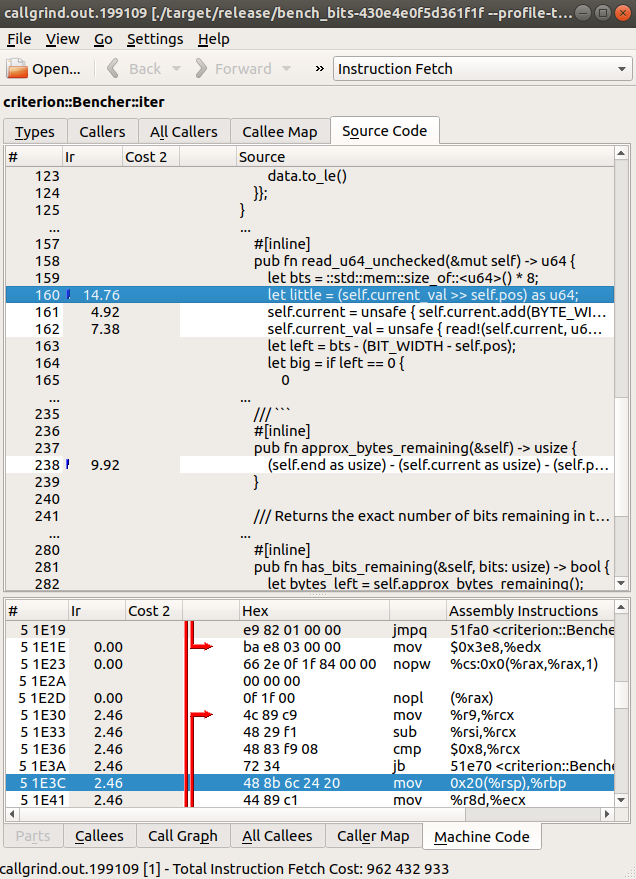
And we can navigate in kcachegrind to lines of code with the most instructions executed in them, and typically execution time scales with instructions executed.

Profiling benchmark run in KCachegrind
Don’t worry if nothing stands out. I just wanted to take a screenshot of what a profiling result looks like (with the assembly of the line highlighted below). The goal of profiling is to receive a better inclination of the code base. Hopefully you’ll find hidden hot spots, fix them, and then see the improvement on the next criterion run.
While I’ve only focussed on Criterion, valgrind, kcachegrind – your needs may be better suited by flame graphs and flamer.
Make everything reproducible
Creating a benchmark and reports mean nothing if they are ephemeral, as no one else can reproduce what you did including yourself when your memory fades.
- Include instructions in the readme on how to run the benchmark and generate any necessary output (eg:
cargo clean
RUSTFLAGS="-C target-cpu=native" cargo bench -- bit-reading
find ./target -wholename "*/new/raw.csv" -print0 | \
  xargs -0 xsv cat rows > assets/benchmark-data.csv
- Commit the benchmark data to the repo. This may be a little controversial due to benchmarks varying across machines, but since benchmarks may take hours to run – you’ll save yourself and any contributors a ton of time when all they need is the data (for instance, when a visualization needs to be updated). Previous benchmark data can also be used to compare performance throughout time. Only commit new benchmark data when benchmarks have changed or a dependent library used in the comparison is updated.
- Commit the script / instructions to generate graphics. I use R + ggplot2, but one can use matplotlib, gnuplot, or even Chart.js. Doesn’t matter what it is, but if someone points out a typo, you don’t want to scramble to remember how the chart was generated.
General Tips
- Don’t force a narrative
- While it’s important to be able to convey a point with graphics and callouts, ensure that the “competing” implementations are not gimped, as people prefer honesty over gamed benchmarks. Open source is not some winner take all, zero sum environment.
- It’s ok if, after benchmarking, your library isn’t on top. Benchmark suites in and of themselves are extremely useful to a community, see: TechEmpower Web Benchmarks, JSON Benchmark 1 / 2, HTTP / JSON / MP4 parsing benchmarks
- Benchmark older versions of your library so you can accurately track progress or catch regressions. This can easily be done in Rust:
[dev-dependencies.bitterv1]
package = "bitter"
version = "=0.1.0"
and reference it like:
extern crate bitterv1;
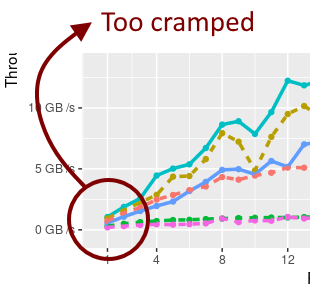
- A single graphic often may not be satisfactory for all use cases. If we examine the chart I posted earlier, cramping is apparent when read sizes are small (< 4 bits), which may be important to some use cases.

The graph contains data that is too cramped to make any meaingful interpretations
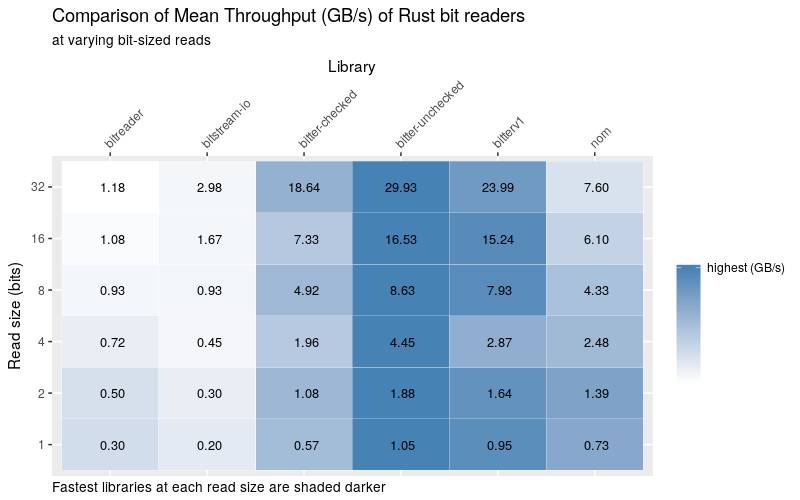
We can fix that with a tasteful table

A table can help clarify the data
Now users can quickly quantify performance at all sizes (well… to the closest power of 2). Being able to see a trend with shading is a bonus here.
- When benchmarking across languages, first try an apples to apples comparison in the same benchmark framework (like Criterion) using a (hopefully) a zero cost
-syscrate for C / C++. Else one can get an approximation using appropriate benchmark harness for each language (make sure it can output data in csv or json):- C++: Google’s benchmark
- C#: BenchmarkDotNet
- Java: Jmh
- Python: timeit or pytest-benchmark
- Javascript: benchmark.js
- HTTP: wrk or k6
- Cli: hyperfine
Conclusion
In summary:
- It’s ok to use benchmark console output in issues / pull requests
- While criterion reports are geared towards contributors, a couple may be devoted to a wider audience in a pinch
- Putting thought into graphics is considerate for potential users
- Profiling with criterion benchmarks + valgrind + kcachegrind is a great way to find hot spots in the code to optimize
- Make benchmark data and graphics reproducible by committing the data / scripts to the repo
Comments
If you'd like to leave a comment, please email [email protected]
Thanks for the introduction to these tools, it’s been a great help.