
Exporting Open Hardware Data into Graphite
Published on:Table of Contents
Update: 2017-11-01: I’ve opensourced this utility as OhmGraphite, It can be ran as a CLI app or Windows service. The code showcased here demonstrates how to get a minimal example running. See the repo for a more production worthy approach!
Hot on the heels of Monitoring Window’s system metrics with Grafana are two fixes for the dashboard. Graphs about the GPU and power usage were missing from the dashboard, but I’m happy to state that I’ve fixed this with the help from Open Hardware Monitor, which is an open source application/library for reading sensor data from computer components. I was able to utilize this library to send this data into graphite to be displayed on my grafana dashboards!
The plan is to create a simple Windows service that will run on boot and feed data into graphite.
Open Hardware Monitor WMI
Open Hardware Monitor publishes all sensor data to WMI, but since I’m not familiar with WMI, it sounds like another layer of indirection from the hardware. I’d also like to not run the application, which I’m presuming is what is required to send to WMI. Not to mention I’d still need to write the code to export WMI metrics to graphite. Since graphite has such a simple easy API for feeding data into it, writing custom code will be the quickest way to see the data.
Open Hardware Monitor Library
I’ve mentioned that Open Hardware Monitor has a library, but did I mention that library is out of date? To get the widest range of hardware compatibility, we’ll need to work off the master branch in the source code. It’s inconvenient, but not a show stopper, as we’ll just need to reference our local build in our code.
Hardware Caveat
Open Hardware Monitor is great, but there are some holes. My Asus Z170 Pro Gaming motherboard has zero sensors registered. There looks to be an outstanding issue for this. The following pull request shows fan speeds, but not much else. I suspect there must be other hardware configurations where sensors are not detected, so user beware.
Once my motherboard support is added to the library I’ll be able to add panels showing voltages, temperatures, and fan speeds across multiple components.
The Code
Since Open Hardware Monitor is written in C#, our service will also. Our code uses some C# features, so some syntax may look new to C# veterans (I’m certainly still getting used to it).
using System;
using System.ComponentModel;
using System.Configuration.Install;
using System.IO;
using System.Net.Sockets;
using System.ServiceProcess;
using System.Threading;
using OpenHardwareMonitor.Hardware;
using Timer = System.Timers.Timer;

namespace ConsoleApp
{
    public class Program
    {
        static void Main(string[] args)
        {
            // Run as windows service if we're not in a terminal
            if (!Environment.UserInteractive)
            {
                ServiceBase.Run(new OhmGraphite());
            }
            else
            {
                OhmGraphite.RunDaemon();
            }
        }
    }

    // Derive from `ServiceBase` so that this program can be a console app as well as a
    // windows service.
    public class OhmGraphite : ServiceBase
    {
        // token that'll be used to receive a stop event from windows services
        private static readonly CancellationTokenSource Source = new CancellationTokenSource();

        // Create a looping timer that triggers an event every 5 seconds
        private static Timer _timer = new Timer(interval: 5 * 1000) { AutoReset = true };

        public static void RunDaemon()
        {
            // We'll want to capture all available hardware metrics
            // to send to graphite
            var computer = new Computer
            {
                GPUEnabled = true,
                MainboardEnabled = true,
                CPUEnabled = true,
                RAMEnabled = true,
                FanControllerEnabled = true,
                HDDEnabled = true
            };

            // Aside: wish that the API supported `using`
            computer.Open();

            try
            {
                // Hardcode TCP connection to our local graphite server
                using (var client = new TcpClient("192.168.137.201", 2003))
                using (var networkStream = client.GetStream())
                using (var writer = new StreamWriter(networkStream))
                {
                    // Start timing
                    _timer.Enabled = true;

                    // Since this block will never finish normal execution, the writer will
                    // not be disposed under normal circumstances, so it is ok to capture the
                    // writer for our event (this would normally be bad practice because the
                    // event could be using a disposed writer)
                    _timer.Elapsed += (sender, eventArgs) => CaptureMetrics(computer, writer);

                    while (!Source.IsCancellationRequested)
                    {
                        // 2147483647ms < 25 days, and since systems can be online longer than
                        // 25 days, loop forever, sleeping 25 days at a time. No need to
                        // check for return value because the while loop checks if a
                        // cancellation has occurred
                        Source.Token.WaitHandle.WaitOne(millisecondsTimeout: int.MaxValue);
                    }

                    // Set timer to null, which will de-register all events so that the
                    // elapsed event doesn't have access to a disposed writer
                    _timer = null;
                }
            }
            finally
            {
                // When this application has been interrupted or computer shutdown, clean
                // up all resources from the usings and the computer
                computer.Close();
            }
        }

        private static void CaptureMetrics(IComputer computer, TextWriter writer)
        {
            // Grab unix timestamp at the start of the update so that all metrics
            // are reported at the same time.
            var time = DateTimeOffset.UtcNow.ToUnixTimeSeconds();
            foreach (var hardware in computer.Hardware)
            {
                hardware.Update();
                foreach (var hardwareSensor in hardware.Sensors)
                {
                    // Take the sensor's identifier (eg. /nvidiagpu/0/load/0)
                    // and tranform into nvidiagpu.0.load.<name> where <name>
                    // is the name of the sensor lowercased with spaces removed.
                    // A name like "GPU Core" is turned into "gpucore". Also
                    // since some names are like "cpucore#2", turn them into
                    // separate metrics by replacing "#" with "."
                    var name = hardwareSensor.Identifier.ToString()
                        .Replace('/', '.')
                        .Substring(1);
                    name = name.Remove(name.LastIndexOf('.'));
                    name += '.' + hardwareSensor.Name.ToLower()
                                .Replace(" ", null).Replace('#', '.');

                    // Graphite API wants <metric> <value> <timestamp>. We prefix the metric
                    // with `ohm` as to not overwrite potentially existing metrics
                    writer.WriteLine($"ohm.{name} {hardwareSensor.Value ?? 0.0} {time:d}");
                }
            }

            // Output current to time to stdout to track progress
            Console.Out.WriteLine($"{DateTimeOffset.Now:s}");
        }

        protected override void OnStart(string[] args) => RunDaemon();
        protected override void OnStop() => Source.Cancel();
    }
}
And can’t forget the bit of code that is used to install our service:
[RunInstaller(true)]
public class OhmGraphiteInstaller : Installer
{
    public OhmGraphiteInstaller()
    {
        // Instantiate installers for process and services.
        var processInstaller = new ServiceProcessInstaller
        {
            Account = ServiceAccount.LocalSystem
        };

        var serviceInstaller1 = new ServiceInstaller
        {
            StartType = ServiceStartMode.Automatic,
            ServiceName = "ohm-graphite"
        };

        Installers.Add(serviceInstaller1);
        Installers.Add(processInstaller);
    }
}
And the command to install.
"C:\Windows\Microsoft.NET\Framework\v4.0.30319\installutil.exe" \
  C:\Apps\ohm-graphite\ConsoleApp.exe
If you want to run the code interactively, make sure to run it as administrator for CPU power and temperature.
Status
I’m calling the code “ohm-graphite”. It has the potential to be packaged as a library or application for others, but since I’m still testing the waters (I mean, I wrote the code in a couple hours). So for other graphite + grafana + windows power users (and how many those are out there?), feel free to snag the code under MIT.
Results
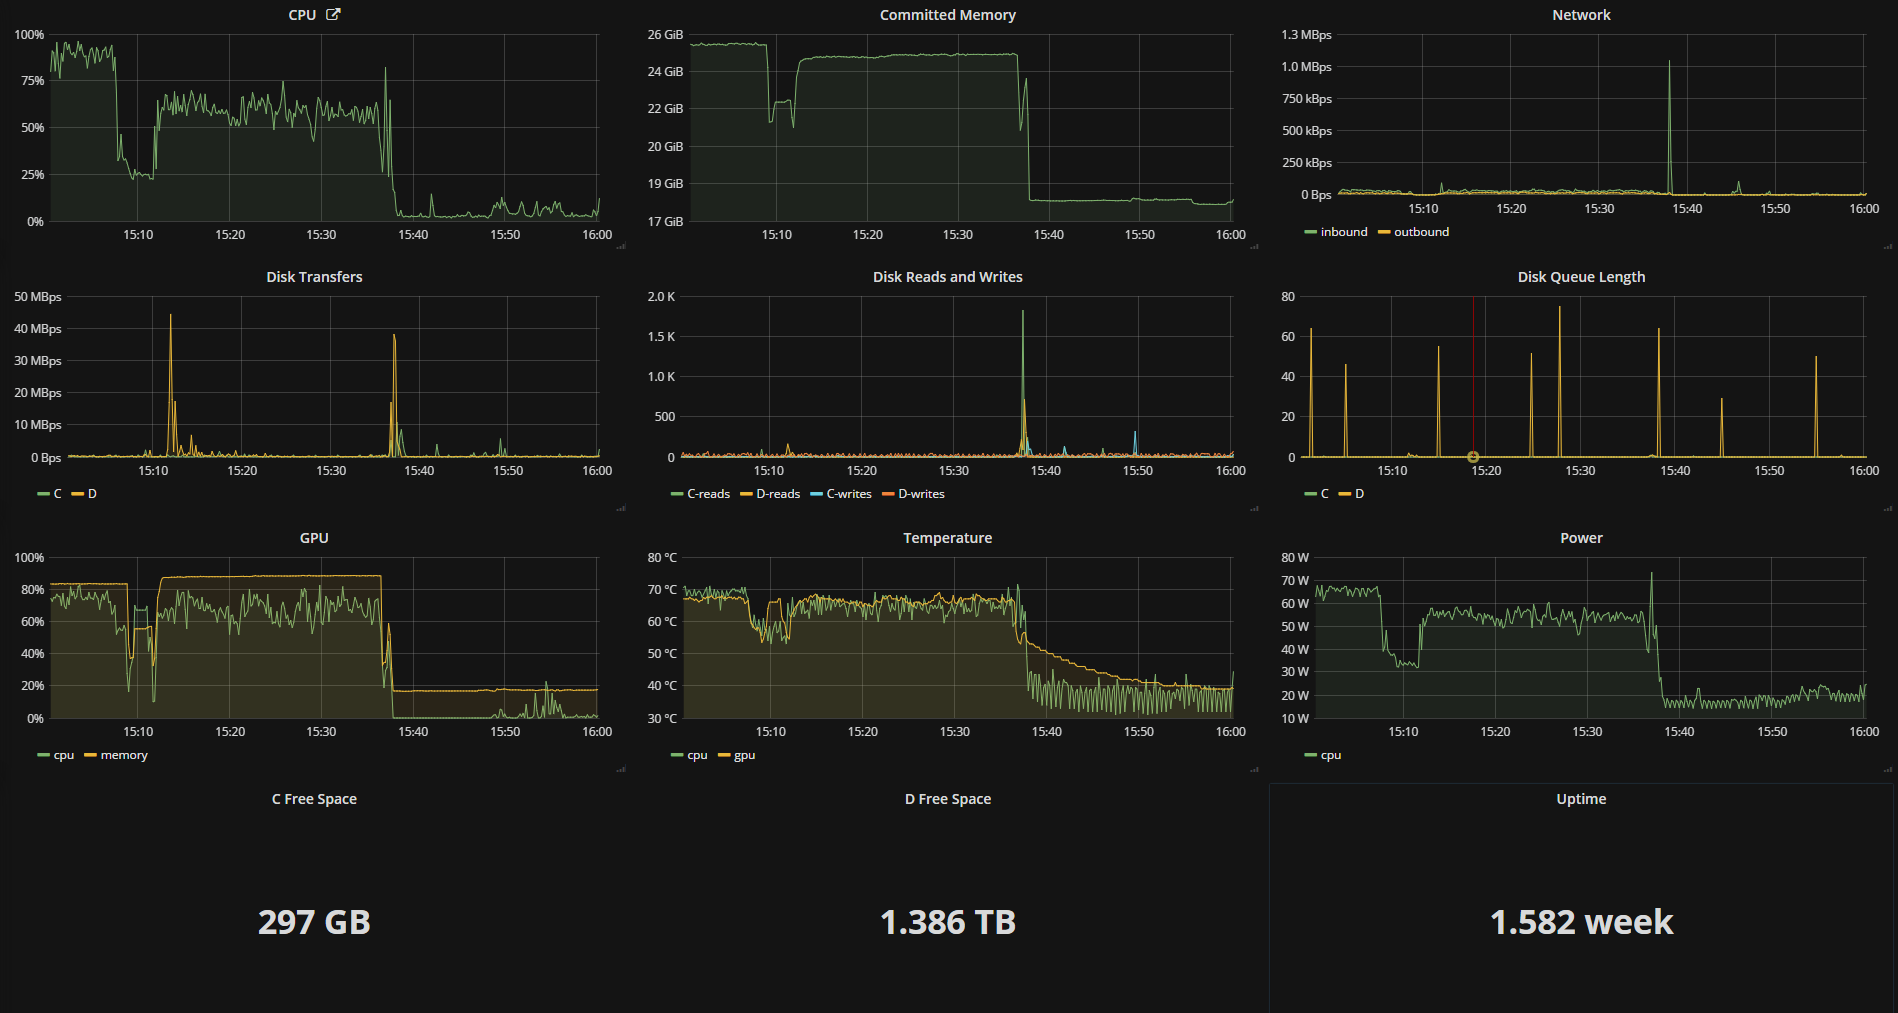
The dashboard from OhmGraphite
Can you tell when I stopped playing video games!
Comments
If you'd like to leave a comment, please email [email protected]
Hey Nick, great post. My c# is no good, could you share how it’s all put together? Do you have a fork up on github that shows how your code fits in with the OHM build?
Hey Nick. Where do I snag the “ohm-graphite” code? I looked under your github page, but I’m not seeing anything? HMU!
Hi, as per Brett’s request. Please can you provide a fork on Github! I’m unsure how you’ve compiled this as I have no experience with C!
Hey everyone, I’ve opensourced it as OhmGraphite. Unzip the executable to a directory, edit the config to reference your graphite instance, and away you go!
Just want to say that I pulled OhmGraphite and it works great, exactly as intended. Awesome work!
DO you have something compatible with Prometheus instead of graphite or influxdb?
Are there any Dashboards available for Inport in Grafana? would make a lot things easier :) or a doku that shows what measurement is what unit ? i get raw numbers but can interpret them without knowing what units are used. And thanks for your work :)
Yes OhmGraphite has supported Prometheus and InfluxDB for quite some time and there are now sample dashboards on grafana.com to get you started with OhmGraphite